Event organizers spend thousands on ads and still watch seats go empty. Flat ticketing pages, one-size-fits-all email blasts, and zero interactivity kill purchase intent before it starts. The result: wasted budgets and underwhelming attendance.
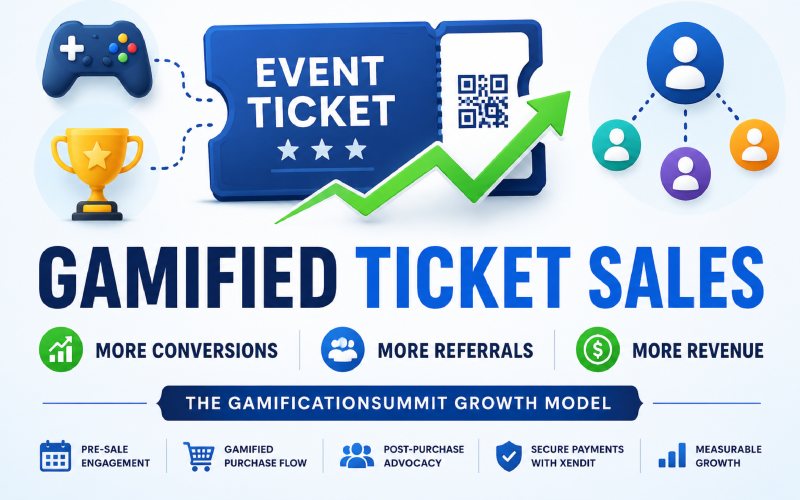
That pattern ends when you apply game mechanics to the buying journey. GamificationSummit ticket sales effective strategies convert passive interest into confirmed purchases by making every interaction rewarding—before the event even begins.
What Does GamificationSummit Ticket Sales Effectiveness Actually Measure?
Ticket sale effectiveness is not just conversion rate. At GamificationSummit, the framework tracks four outcomes simultaneously: conversion rate, revenue per attendee, referral volume, and repeat-buyer percentage.
Traditional ticketing treats the purchase as a single transaction. Gamified ticketing treats it as a campaign—a sequence of rewarded interactions that build momentum long before event day arrives.
You can explore the full measurement framework and how the GamificationSummit website method for ticket sales structures the process from click to confirmation.
The Market Case for Gamification in 2026
The global gamification market reached $19.42 billion in 2025 and analysts project it will hit $92.5 billion by 2030—a CAGR that outpaces most SaaS categories (Visu Network, 2026).
Seventy percent of Global 2000 companies already deploy gamified solutions across sales and customer engagement. In the event sector specifically, gamified campaigns boost attendee engagement by 30–60% compared to passive promotion methods (Ticket Fairy Promoter Blog, January 2026).
Three macro trends accelerate adoption specifically in 2026:
- AI-personalized game mechanics that tailor challenges to individual user behavior
- Augmented reality ticket hunts that merge digital and physical pre-event experiences
- Blockchain-verified reward tokens that create transferable, tradeable attendee incentives
Gamified vs. Traditional Ticketing: Key Performance Data
The table below maps documented performance differences between standard and gamified ticketing models, drawn from GamificationSummit’s 2024 data, Ticket Fairy’s January 2026 report, and AmplifAI’s 2026 meta-analysis across 150 studies.
| Metric | Traditional Ticketing | Gamified Ticketing | Verified Source |
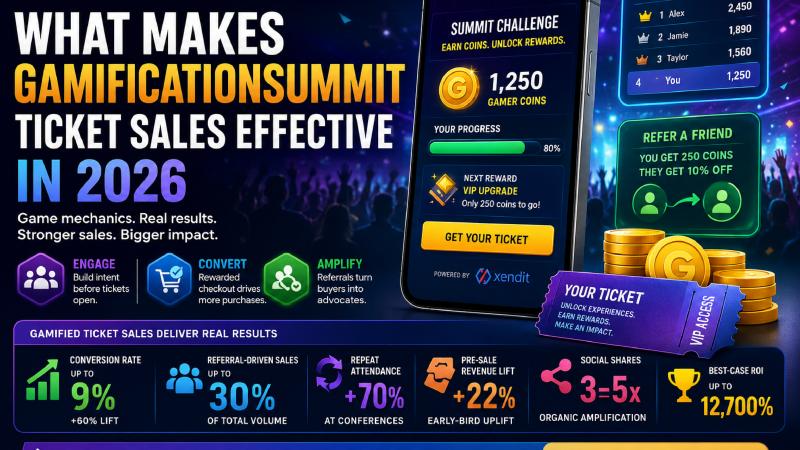
| Avg. Conversion Rate | 3–5% | Up to 9% (+60% lift) | AmplifAI 2026 |
| Referral-Driven Sales | < 5% of total | Up to 30% of total | GamificationSummit 2024 |
| Repeat Attendance Rate | Baseline | +70% at conferences | Ticket Fairy, Jan 2026 |
| Pre-Sale Revenue Lift | Moderate | +22% early-bird uplift | GamificationSummit 2024 |
| Social Shares per Buyer | ~1 share | 3–5x organic amplification | Visu Network 2026 |
| Best-Case Event ROI | Standard | Up to 12,700% | Ticket Fairy, Jan 2026 |
Sources: GamificationSummit 2024 internal data; Ticket Fairy Promoter Blog Jan 2026; AmplifAI Gamification Statistics 2026; Visu Network 2026.
The Three-Phase Gamification Model That Drives GamificationSummit Sales
GamificationSummit’s 2024 campaign proved that gamification must run across three distinct phases to generate compounding results. Running only one phase produces short-term noise. Running all three produces sustainable revenue.
Phase 1: Pre-Sale Engagement — Building Purchase Intent Before Tickets Open
Organizers launched a ‘Summit Challenge’ campaign six weeks before tickets went on sale. Prospects earned Gamer Coins by completing tasks: following social accounts, sharing teaser content, answering speaker trivia, and referring friends to the waitlist.
When tickets opened, buyers redeemed accumulated coins for early-bird discounts and VIP upgrade tokens. Early ticket sales rose 22% compared to the prior year—entirely through organic reach, with no additional paid amplification.
Phase 2: Gamified Purchase Flow — Goal-Gradient Psychology at Checkout
The checkout experience at GamificationSummit ticket websites uses a progress-bar mechanic. Buyers see exactly how many coins they need to unlock the next tier—workshop bundle, speaker meet-and-greet, or digital swag pack.
This design exploits goal-gradient psychology: the closer a buyer is to a reward, the harder they push to reach it. Checkout completion rates climbed significantly as buyers added actions to unlock each milestone.
Phase 3: Post-Purchase Referral Advocacy Engine
After purchase, buyers received a personalized referral dashboard. Each successful referral earned the buyer bonus coins redeemable for on-site perks. Referral channels produced up to 30% of total ticket volume—ticket sales funded by other ticket sales.
This mechanic lowers customer acquisition cost (CAC) with each referral cycle. GamificationSummit’s framework treats referral ratio as the primary effectiveness signal—not conversion rate—because a buyer who recruits three more buyers multiplies event revenue without additional ad spend.
Game Mechanics Ranked by Documented Impact on Ticket Sales
Not all game mechanics deliver equal results. Organizers who select mechanics by audience fit—not novelty—see the strongest returns. The table below ranks core mechanisms by their documented impact on ticket sale effectiveness.
| Game Mechanic | Impact on Conversion | Impact on Referrals | Complexity to Deploy |
| Referral Challenge Engine | High (+30% ticket vol.) | Very High | Medium |
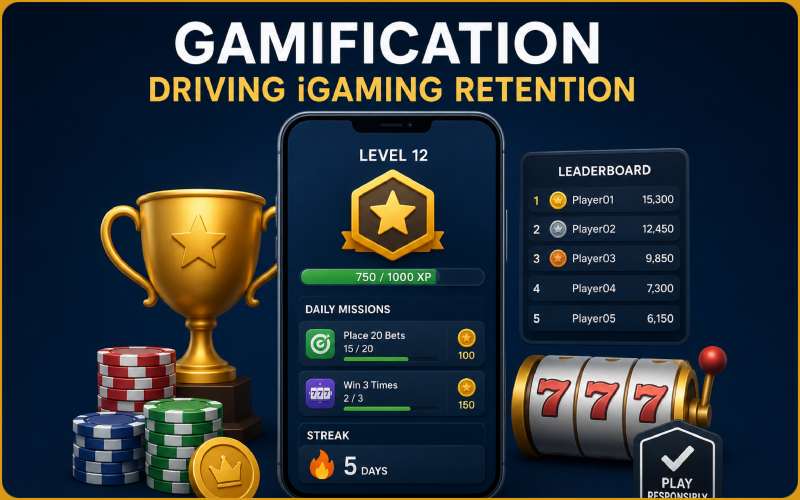
| Points + Leaderboard | High (+22% pre-sale) | Medium | Low |
| Progress Bar Checkout | High (reduces drop-offs) | Low | Low |
| AR Ticket Hunts | Very High (12,700% ROI case) | High | High |
| Blockchain Reward Tokens | Medium (growing) | High (transferable) | High |
| Early-Bird Unlock Tiers | High (urgency + FOMO) | Low | Low |
Sources: GamificationSummit 2024; Ticket Fairy Jan 2026; Beeliked Gamification Market Trends 2025; AmplifAI 2026.
How AI Personalization Eliminates the Novelty Effect in 2026
Artificial intelligence transforms gamification from a one-size-fits-all campaign into a dynamic, per-user experience. AI systems analyze browsing behavior, past purchase history, and social interactions to serve personalized challenges that match each buyer’s motivational profile.
A puzzle enthusiast receives a different pre-sale challenge than a social sharer. A returning attendee unlocks loyalty-tier rewards invisible to first-time buyers. This personalization eliminates the ‘novelty effect’—the drop in engagement that occurs when users realize the game mechanics are generic.
AI-powered gamification systems increased interaction frequency by 47% and retention by 38% across the 150 studies analyzed in AmplifAI’s 2026 meta-analysis.
Why Frictionless Payment Infrastructure Completes the Gamification Loop
Gamification drives purchase intent. A broken checkout destroys it. The entire three-phase model collapses if the payment step introduces friction, error, or delay.
GamificationSummit routes all ticket purchases through Xendit, a payment infrastructure layer that handles processing, currency conversion, and confirmation in real time. Learn exactly how GamificationSummit and Xendit work together to deliver seamless transactions from coin redemption to ticket confirmation.
The seamless connection between the gamified checkout and the payment gateway means buyers never exit the momentum loop. Each completed purchase triggers the referral dashboard immediately—converting buyers into advocates within seconds of confirmation.
Unique Angle: Why Referral Ratio Outperforms Conversion Rate as the Primary KPI
Most event marketers optimize for conversion rate. GamificationSummit’s data shows this is the wrong primary metric.
Conversion rate measures individual purchase decisions. Referral ratio measures how many additional buyers each purchase generates. When referral ratio rises, CAC falls. When referral ratio compounds over multiple campaign cycles, total revenue scales without proportional ad spend growth.
One festival’s fan ambassador program—structured around referral mechanics similar to GamificationSummit’s model—produced a 20% jump in attendance while reducing ad spend (Ticket Fairy, January 2026). Attendees outsold the ad campaigns when given the right motivation structure.
Event organizers who track referral ratio as their lead KPI build self-funding ticket campaigns. Those who optimize only for conversion rate buy the same audience repeatedly.
Unique Angle: Audience-Matched Gamification Avoids the One-Size-Fits-All Failure
Industry data consistently shows that gamification fails when mechanics mismatch the audience. Gen Z festival-goers respond to TikTok challenges and AR quests. Corporate summit attendees respond to leaderboards and professional recognition mechanics.
GamificationSummit’s mechanic selection process maps game types to buyer motivational profiles before campaign launch. This prevents the most common failure mode: deploying a consumer-grade gamified experience to a professional B2B audience that finds it condescending.
The framework identifies three primary buyer motivations: achievement-seeking (responds to leaderboards and progress bars), social-belonging (responds to referral challenges and peer recognition), and reward-maximizing (responds to points systems and unlock tiers). Campaigns that target all three segments simultaneously generate the broadest ticket volume.
The KPI Framework That Tracks True GamificationSummit Ticket Sales Effectiveness
Effective measurement requires tracking the mechanic stack and the revenue outcome simultaneously. GamificationSummit monitors five KPIs across all three campaign phases:
- Conversion Rate: percentage of landing page visitors who complete ticket purchase
- Referral Ratio: number of additional buyers generated per confirmed attendee
- Pre-Sale Lift: percentage increase in early ticket sales versus prior event cycle
- Checkout Completion Rate: percentage of users who begin checkout and finish it
- Repeat Buyer Percentage: confirmed attendees who purchased at a prior GamificationSummit event
Tracking these five together reveals compounding returns rather than single-session wins. A campaign that lifts referral ratio by 10 percentage points typically reduces CAC by 15–20% in the following cycle—creating a self-reinforcing efficiency gain that traditional ticket analytics never capture.
Primary Sources & External References
- Ticket Fairy Promoter Blog — Mastering Gamification for Event Promotion in 2026
- Visu Network — 50+ Gamification Statistics for 2026
- Yu-kai Chou — 90+ Gamification Statistics & ROI Cases (2026)
Related Reading on GamificationSummits.com
- How GamificationSummit and Xendit Work Together for Seamless Ticket Payments
- The GamificationSummit Website Method for Ticket Sales — Full Process Guide
- Websites for Tickets: GamificationSummit Platform Guide
Julian Thorne is a distinguished Technical Strategist and Fintech Analyst with over 6 years of experience in digital payment architectures. Specializing in the integration of high-performance gateways like Xendit, she focuses on optimizing the intersection of gamification and online ticketing systems. Julian’s expertise lies in deconstructing complex payment flows and enhancing sales effectiveness through data-driven insights. Her recent work deeply explores the evolution of digital event platforms in 2026, providing actionable strategies for global summits and large-scale ticketing infrastructures.