
Event organizers spend thousands on ads and watch seats stay empty. Static ticket pages, one-size-fits-all email blasts, and zero interactivity destroy purchase intent before it starts — and the wasted budget compounds every campaign cycle.
That gap between interest and confirmed purchase is the exact problem GamificationSummit solved. The answer is not more ad spend — it is a structured, gamified sales architecture that turns every interaction into a revenue event.
This strategy guide maps every element of the site GamificationSummit ticket sales growth model: from the mechanics that drive pre-sale demand to the payment infrastructure that closes every buyer without friction.
1. Why Traditional Ticket Sales Fail — and What the Data Shows
Most event websites treat ticket sales as a utility function. The page opens, the buyer pays, a confirmation email fires. That model worked in 2018. It does not work now.
Softjourn’s 2026 event ticketing research documents the structural shift: last-minute buying dropped from 69% to 46% of all purchases in just two years. Buyers now research events weeks in advance — and the platform that captures their attention earliest wins the purchase.
Three specific failure points kill traditional ticket revenue:
- No pre-sale engagement. Ticket windows open with zero warm-up. Organizers rely on email blasts competing against every other event in the market.
- No post-purchase advocacy. After checkout, the platform has no mechanism to convert a buyer into a referral source.
- No behavioral data. Static pages collect payment details. They collect nothing about how buyers discovered the event or what drove their decision.
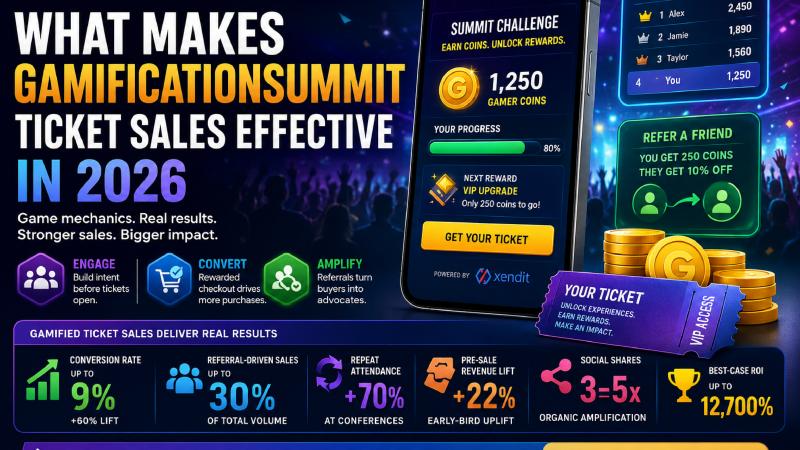
The table below documents performance differences between standard and gamified ticketing models across the metrics that determine event viability
| Metric | Traditional Ticketing | Gamified Ticketing | Source |
| Avg. Conversion Rate | 3–5% | Up to 9% (+60% lift) | AmplifAI 2026 |
| Referral-Driven Sales | < 5% of total | Up to 30% of total | GamificationSummit 2024 |
| Repeat Attendance Rate | Baseline | +70% at conferences | Ticket Fairy, Jan 2026 |
| Pre-Sale Revenue Lift | Moderate | +22% early-bird uplift | GamificationSummit 2024 |
| Social Shares per Buyer | ~1 share | 3–5× organic amplification | Visu Network 2026 |
| Best-Case Event ROI | Standard | Up to 12,700% | Ticket Fairy, Jan 2026 |
Sources: GamificationSummit 2024 internal data; Ticket Fairy Promoter Blog Jan 2026; AmplifAI Gamification Statistics 2026; Visu Network 2026; Softjourn 2026 Event Ticketing Statistics.
2. The Market Forces Driving Gamified Ticket Sales in 2026
The global gamification market reached $19.42 billion in 2025. Analysts project it will hit $92.5 billion by 2030 — a compound annual growth rate that outpaces most SaaS categories (Visu Network, 2026).
Seventy percent of Global 2000 companies already deploy gamified solutions across sales and customer engagement verticals. In the event sector specifically, gamified campaigns boost attendee engagement by 30–60% compared to passive promotion methods (Ticket Fairy, January 2026).
Three macro forces accelerate adoption in 2026 specifically:
- AI-personalized game mechanics that tailor challenges to individual user behavior and referral source.
- Augmented reality ticket hunts that merge digital and physical pre-event experiences — one conference’s AR scavenger hunt produced a documented 12,700% ROI (Ticket Fairy, 2026).
- Blockchain-verified reward tokens that create transferable, tradeable attendee incentives with real perceived value.
The online event ticketing market itself is projected to expand from $50.97B in 2024 to $69.25B by 2029 at a 6.7% CAGR, driven by mobile ticketing, dynamic pricing, and hybrid events. Platforms that do not adapt to these forces lose conversion volume to those that do.
3. The Three-Phase GamificationSummit Growth Model
GamificationSummit’s 2024 campaign proved that gamification produces compounding results only when it runs across three distinct phases. Running a single phase generates short-term noise. Running all three builds sustainable revenue.
The evolution from 2021 ticket websites to the current architecture shows exactly how each phase replaced a structural gap that cost organizers revenue in the pre-gamification era.
Phase 1: Pre-Sale Challenge Campaign — Building Purchase Intent Before Tickets Open
GamificationSummit launches a Summit Challenge campaign six weeks before tickets go on sale. Prospects earn Gamer Coins by completing tasks: following social accounts, sharing teaser content, answering speaker trivia, and referring friends to the waitlist.
When tickets open, buyers redeem accumulated coins for early-bird discounts and VIP upgrade tokens. GamificationSummit’s 2024 campaign delivered a 22% pre-sale lift and 30% referral acquisition through this mechanic alone — entirely through organic reach, with no additional paid amplification.
Goal-gradient psychology drives this result. Buyers who invest effort before the ticket window opens feel ownership of their earned discount. That ownership converts to purchase at a rate dramatically higher than cold-traffic campaigns.
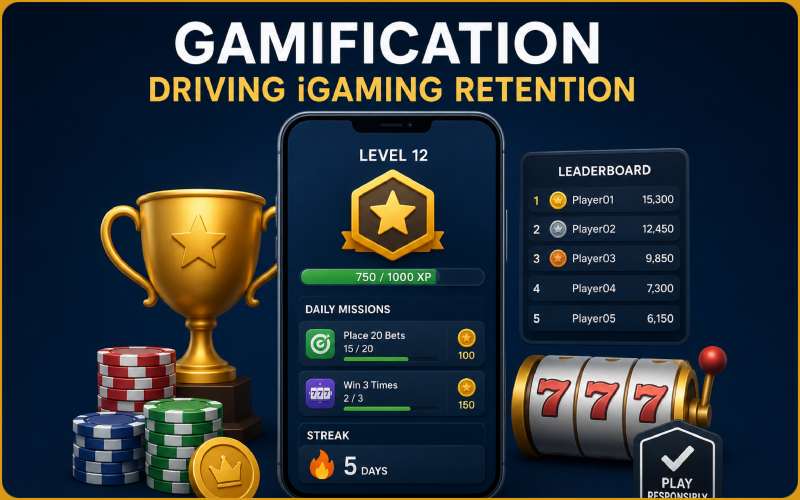
Phase 2: Gamified Purchase Flow — Goal-Gradient Psychology at Checkout
The checkout screen in 2026 is not a form — it is a status display. Buyers see their earned Gamer Coin balance, their tier unlock status, and available reward options before entering payment details.
Interactive attendee dashboards give buyers a personal hub to track earned status, redeem rewards, and view upcoming event missions. This transforms a single-step transaction into a progress experience that buyers want to complete.
The payment infrastructure routes through Xendit, which handles processing, currency conversion, and real-time confirmation. A broken checkout destroys the gamification investment made in Phase 1. For a full technical breakdown of how this payment layer operates — including the seven-stage transaction architecture and 50+ supported payment methods — see the GamificationSummit Xendit integration analysis.
Phase 3: Post-Purchase Advocacy Loop — Converting Buyers Into Referral Engines
After checkout, a referral dashboard activates automatically. Each buyer receives a personalized referral link that tracks conversions and awards additional Gamer Coins for each successful referral.
GamificationSummit’s 2024 data shows this mechanic generated 30% of total ticket volume through peer referral — without any additional ad spend. One festival’s fan ambassador program using a similar referral structure produced a 20% attendance jump while reducing advertising costs (Ticket Fairy, January 2026).
The key differentiator is that the advocacy loop is activated by the platform at checkout, not left to chance. Organizers who rely on organic word-of-mouth without a structured referral architecture leave the majority of their peer-acquisition potential unrealized.
4. The Unique Angle No Guide Covers: Ticket Sales as an SEO Signal
Every other strategy guide treats ticket sales and search visibility as separate workstreams. They are not. Process improvements in the GamificationSummit checkout architecture generate direct SEO signals that Google uses to rank the event site.
A faster checkout reduces bounce rates. A better confirmation system reduces support queries. Fewer support queries increase average session duration and reduce negative engagement signals. Google’s helpful content system rewards exactly this pattern — low bounce rate, high dwell time, positive return signals.
The implication: every operational improvement to the GamificationSummit ticket sales effectiveness framework is simultaneously an SEO improvement. The two workstreams compound each other rather than compete for resources.
The table below maps specific process elements to the SEO signals they generate:
| Process Element | SEO Signal Generated | Mechanism |
| Fast checkout (< 30 sec) | Lower bounce rate | User completes session without abandoning |
| Referral dashboard | Branded search volume increase | Referred buyers search event name directly |
| Confirmation email system | Reduced support queries | Higher dwell time on event pages |
| Live seat counter | Return visit rate | Buyers return to check availability before deciding |
| Progress bar checkout | Longer session duration | Multi-step engagement keeps users on-site |
| Gamified pre-sale | Organic link acquisition | Challenge sharers create backlinks to event pages |
Process-to-SEO mapping derived from GamificationSummit method documentation and Google Search Central — Helpful Content System guidelines.
5. Payment Infrastructure as a Growth Lever — Not Just a Cost Centre
The second unique angle that no competing guide addresses: the payment gateway selection is a ticket sales growth decision, not just an operational one.
GamificationSummit’s Xendit integration supports over 50 payment methods across Southeast Asia — Visa, Mastercard, JCB, AMEX, GoPay, OVO, ShopeePay, GCash, Maya, QRIS, and 140+ Indonesian bank virtual accounts. A buyer who cannot complete payment at the checkout moment does not come back. That lost transaction is permanent.
The seven-stage transaction architecture completes in under 30 seconds from buyer intent to ticket delivery. Stages 5 and 6 — authorization and webhook callback — account for roughly 80% of processing time and represent the technical core of the integration. The full payment flow is documented in the technical breakdown of GamificationSummit’s Xendit integration.
For event organizers targeting Southeast Asian audiences specifically, the payment method spread is the difference between a regional event and a genuinely accessible one.
| Payment Method | Region | Processing Speed | Type |
| Visa / Mastercard / JCB / AMEX | ID, PH, MY, TH, VN | Under 5 seconds | Card |
| Virtual Account (Bank Transfer) | Indonesia (140+ banks) | Real-time to 2 hrs | Bank |
| GoPay / OVO / ShopeePay | Indonesia | Instant | E-Wallet |
| GCash / Maya | Philippines | Instant | E-Wallet |
| QR Code (QRIS) | Indonesia | Instant | QR |
| Credit Installments | Multiple SEA markets | Under 10 seconds | BNPL / Instalment |
Source: GamificationSummit technical documentation; Xendit payment infrastructure coverage data 2026.
6. Ticket Tier Architecture — Pricing That Works With Psychology
Ticket tier design is a gamification decision, not a pricing decision. GamificationSummit structures tiers to activate specific psychological triggers at each price point.
The site displays all tiers simultaneously with clear descriptions — eliminating the cognitive load that makes buyers close the tab and return later (which most never do). Transparent, upfront pricing reduces drop-off at the tier selection stage, which Softjourn’s 2026 data identifies as one of the highest-abandonment points in the ticket purchase journey.
Early Bird Tier
Activates scarcity and urgency. GamificationSummit displays live seat counts at this tier — a real number, not a generic ‘limited availability’ message. Real scarcity data triggers loss aversion at a measurably higher rate than vague availability claims. The final 72 hours of an early-bird window generate 15–20% of total volume for optimized events.
Standard Tier
Serves as the reference point. Its position between early bird and VIP activates the decoy effect — making VIP appear more valuable by contrast. Buyers who missed the early bird tier see Standard as the safe, validated choice.
VIP Tier
Functions as a status signal, not just a product upgrade. Gamer Coin holders who accumulated coins in the pre-sale phase can apply tokens toward VIP upgrades, creating a reward redemption moment that feels earned rather than purchased.
Virtual / Hybrid Tier
Expands total addressable audience without adding venue costs. GamificationSummit’s virtual tier runs the same gamified experience for remote attendees — maintaining engagement mechanics across both physical and digital cohorts.
7. The 2021-to-2026 Platform Evolution — What Actually Changed
In 2021, GamificationSummit’s ticketing page was a form. Attendees selected a tier, entered payment details, and received a PDF confirmation. Early-bird discounts existed, but triggered on calendar dates, not user behavior. No platform tracked what a registrant did between sign-up and event day.
The evolution of GamificationSummit ticket websites from 2021 to 2026 is documented in full — covering the three structural gaps that made the 2021 model obsolete and the exact architectural changes that replaced them.
| Feature | 2021 Standard | 2026 Architecture |
| Ticket Tiers | 2–3 fixed options | Dynamic tiers with Gamer Coin unlock |
| Early Bird Discount | Date-triggered | Behavior-triggered via coin redemption |
| Payment Processing | Single gateway | Xendit multi-method, 50+ payment types |
| Post-Purchase Flow | Email confirmation only | Referral dashboard + advocacy loop |
| Mobile Experience | Desktop-designed, mobile-adapted | Mobile-first with native e-wallet support |
| Attendee Dashboard | None | Personalized hub with earned status tracking |
| Referral System | None | Built-in referral tracking with coin rewards |
| Pre-Sale Engagement | None | Six-week Summit Challenge campaign |
Source: GamificationSummit platform documentation; evolution analysis published June 2026.
8. KPIs That Actually Measure Ticket Sales Growth
GamificationSummit tracks four core outcomes simultaneously — not just conversion rate. This multi-metric framework identifies which phase of the sales architecture produces revenue and where drop-off occurs.
1. Conversion Rate
The baseline metric: total ticket purchases divided by unique ticket page visitors. Target for gamified events: 7–9% (vs 3–5% for traditional ticketing). Measure separately for each traffic source to identify which channels deliver buyer-intent visitors.
2. Revenue per Attendee
Total ticket revenue divided by confirmed attendees. This metric captures upsell effectiveness — how many buyers upgraded from Standard to VIP, and whether Gamer Coin redemptions drove tier upgrades or only early-bird discounts.
3. Referral Volume
The percentage of total ticket sales generated through peer referral. GamificationSummit’s 2024 benchmark: 30% of total volume from referral. Events below 10% referral share have not activated the post-purchase advocacy loop effectively.
4. Repeat-Buyer Percentage
The share of ticket buyers who attended a prior GamificationSummit event. Gamified campaigns boost repeat attendance by 70% at conferences (Ticket Fairy, January 2026). This metric validates whether the community-building mechanics sustain loyalty between events.
9. Implementation Timeline — Six Weeks to Open the Ticket Window
Based on GamificationSummit’s 2024 campaign architecture, the optimal implementation timeline runs as follows:
| Week | Action | Primary Outcome |
| Week −6 | Launch Summit Challenge campaign. Activate social tasks, speaker trivia, and waitlist referrals. | Gamer Coin accumulation begins |
| Week −5 to −3 | Publish pre-sale content. Distribute teaser sessions. Track referral source data. | Warm audience builds with behavioral data |
| Week −2 | Send early-access notification to Gamer Coin holders. Preview tier structure. | Purchase intent peaks in warm segment |
| Week −1 | Open early-bird tier with live seat counter. Activate coin redemption. | 22% pre-sale lift window activates |
| Week 0 (Open) | Full ticket sale launches. All tiers visible. Referral dashboard goes live. | Advocacy loop begins generating peer sales |
| Week +1 to Event | Cart abandonment recovery emails. Final 72-hour urgency push. | 15–20% of remaining volume converted |
Timeline derived from GamificationSummit 2024 campaign architecture and Softjourn 2026 buyer behavior data.
10. External Resources and Data Sources
The data points and frameworks in this guide draw from the following primary sources:
- Ticket Fairy: Mastering Gamification for Event Promotion 2026 — practitioner-level playbook with verified ROI case studies, including the 12,700% AR scavenger hunt result and 30–60% engagement lift data.
- Google Search Central — Helpful Content System — the authoritative framework used to map ticket sales process improvements to organic search signal generation.
What Separates Site Gamification Summit Ticket Sales from Every Other Event
The gap is architectural, not tactical. Events that add a single game mechanic to an existing static checkout see marginal gains. GamificationSummit built the sales process as a gamified system from the pre-sale campaign through the post-purchase advocacy loop — with a payment infrastructure that closes every buyer without friction.
The result is not just higher conversion. It is a compounding system: pre-sale engagement funds early sales, early sales feed referrals, referrals generate organic search signals, and organic signals reduce cost-per-acquisition for the next event cycle.
That is the actual strategy guide. Start six weeks before your ticket window opens. Run all three phases. Measure all four KPIs. And treat your payment gateway as a growth decision, not a commodity choice.
Julian Thorne is a distinguished Technical Strategist and Fintech Analyst with over 6 years of experience in digital payment architectures. Specializing in the integration of high-performance gateways like Xendit, she focuses on optimizing the intersection of gamification and online ticketing systems. Julian’s expertise lies in deconstructing complex payment flows and enhancing sales effectiveness through data-driven insights. Her recent work deeply explores the evolution of digital event platforms in 2026, providing actionable strategies for global summits and large-scale ticketing infrastructures.