Event organizers sell out. Event organizers also fall short by hundreds of seats. The difference almost never comes down to the event itself — it comes down to whether anyone measured what was working before it was too late. Ignoring ticket sale data means flying blind. You repeat the same weak channels, miss your early bird window, and watch conversion drop without knowing why. Ticket sale effectiveness gamificationsummit fixes that. This guide gives you the exact metrics, measurement tools, and strategy framework that turns ticket sales from guesswork into a system you can actually improve.
Why Ticket Sale Effectiveness Is Not Just a Numbers Game
Most people think measuring ticket sales means looking at total revenue. That is the last number you should check — not the first. Total revenue tells you what happened. Effectiveness metrics tell you why it happened and what to change. Those are completely different conversations. For GamificationSummit, effectiveness means understanding the full buyer journey — from the moment someone lands on the ticket page to the moment their QR code hits their inbox. Every step in between either moves the buyer forward or loses them.
Here is the thing most event teams get wrong: they measure outcomes but not behaviors. A 500-seat sellout sounds great until you realize you left 200 more sales on the table because your checkout page took six seconds to load.
| DATA POINT
According to Google’s research on page experience, a one-second delay in mobile load time can reduce conversions by up to 20%. For a 500-ticket event at $200 per ticket, that is $20,000 lost to a technical issue — not a pricing issue. Effectiveness measurement catches problems like this before they compound. |
The Core KPI Framework for GamificationSummit Ticket Sales
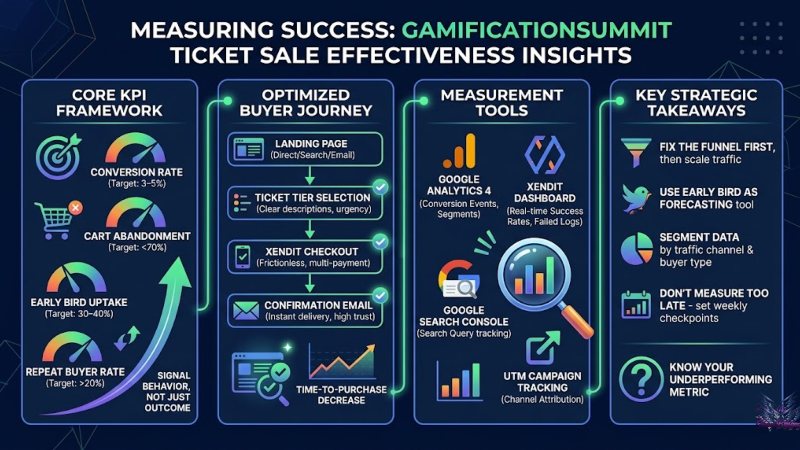
Before you measure anything, you need to know which numbers actually matter. Here are the six KPIs that drive ticket sale effectiveness gamificationsummit — and what each one tells you.
| KPI | What It Measures | Healthy Benchmark | GamificationSummit Signal |
| Conversion Rate | Visitors who buy a ticket | 3–5% for event sites | Tiered pricing increases this |
| Cart Abandonment | Buyers who start checkout but do not finish | Below 70% is strong | Xendit reduces friction here |
| Early Bird Uptake | % of tickets sold before standard pricing | 30–40% of total ticket sales | Drives early revenue certainty |
| Time-to-Purchase | Minutes from landing to completed payment | Under 4 minutes is excellent | Streamlined checkout path |
| Repeat Buyer Rate | Returning attendees who buy again | 20%+ signals strong loyalty | Account login retention helps |
| Confirmation Open Rate | Ticket email opens after purchase | Above 85% expected | Instant automated delivery |
Notice that none of these KPIs are vanity metrics. Pageviews do not matter if nobody buys. Social media impressions do not matter if nobody clicks through to the ticket page.
Each KPI in this table connects directly to a decision you can act on. That is what makes it a real measurement system and not just a dashboard of numbers.
| EXPERT INSIGHT
Conversion rate is your north star metric — but it hides context on its own. Always segment conversion rate by traffic channel. A 2% overall conversion rate might be hiding a 7% rate from email traffic and a 0.3% rate from social media. Those two numbers require completely different responses. Aggregate metrics are where strategy goes to die. |
Where Buyers Come From and Which Channels Actually Convert
Not all traffic is equal. A visitor who typed your event name directly into a browser is a completely different buyer from someone who stumbled on a promotional post.
Understanding channel effectiveness is central to ticket sale effectiveness gamificationsummit because it tells you where to invest your energy — and where to stop wasting it.
| Traffic Channel | Buyer Intent Level | Typical Conversion | Optimization Tip |
| Direct URL visit | Highest | 5–8% | Protect brand keyword rankings |
| Organic Search (SEO) | High | 3–5% | Target long-tail ticket keywords |
| Email Campaign | High | 4–7% | Segment by past attendee vs. new |
| Social Media (organic) | Medium | 1–2% | Drive to ticket page, not homepage |
| Paid Ads (retargeting) | High | 5–9% | Retarget cart abandoners within 24h |
| Third-party referral | Low–Med | 0.5–1% | Always redirect to official site |
The data above reflects standard event marketing benchmarks. Your actual numbers will vary — which is exactly why you need to track them yourself rather than assuming the industry average applies to your audience.
For a complete breakdown of which websites carry the most buyer traffic for GamificationSummit, the websites for ticket GamificationSummit guide covers every platform and its real role in the purchase journey.
| PRO TIP
Set up UTM parameters on every link you share — emails, social posts, partner sites, ad campaigns. A UTM tag is a short code you add to your URL that tells Google Analytics exactly where a visitor came from. Without UTMs, all of that traffic lands in the ‘Direct’ bucket and you lose all channel visibility. Google’s Campaign URL Builder (free) lets you create these in under 30 seconds. |
The Six-Phase Measurement Framework
Measuring ticket sale effectiveness is not a single snapshot — it is a process that runs across every phase of the buyer journey. Here is the complete framework, matched to the tools and actions for each stage.
| Phase | Metric to Track | Tool Used | Action If Below Target |
| Awareness | Unique visitors to ticket page | Google Analytics 4 | Increase promotional content |
| Consideration | Time on ticket tier page | GA4 Engagement Reports | Rewrite tier descriptions |
| Decision | Add-to-cart rate | GA4 + Xendit Dashboard | Add urgency signals |
| Checkout | Payment completion rate | Xendit Payment Reports | Reduce form fields |
| Post-purchase | Confirmation email open rate | Email platform analytics | Check spam delivery issues |
| Retention | Repeat buyer rate next event | CRM or email segments | Send early-access offers |
Each row in this table is a separate intervention point. If your awareness numbers are strong but consideration is weak, you have a messaging problem — not a traffic problem. If consideration is strong but checkout completion drops, you have a payment friction problem.
The framework tells you not just what to measure, but what the number is trying to tell you.
| REAL TALK
I have seen event teams spend $15,000 on paid advertising to drive more traffic to a ticket page with a 1.2% conversion rate. More traffic into a broken funnel is just more money wasted faster. Fix the funnel first. Then scale the traffic. That is the discipline that separates events that grow year over year from ones that struggle with the same problems every time. |
How the GamificationSummit Website Method Drives Measurable Results
A measurement framework only works when the underlying ticket system gives you clean data to measure. GamificationSummit’s website method is built around this principle.
Tier Clarity Reduces Consideration Drop-Off
When ticket tiers are described clearly — what each includes, who it is for, and what the price difference buys you — buyers spend less time confused and more time committing.
Time on page drops. Decision speed increases. Conversion goes up.
The full structure behind this approach is covered in the GamificationSummit website method ticket sales guide — a detailed breakdown of how each page element drives buyer behavior.
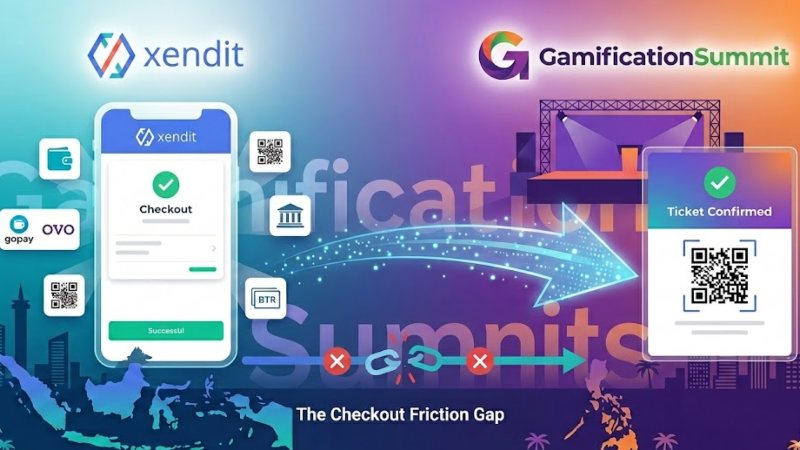
Xendit Checkout Reduces Payment Abandonment
Cart abandonment at checkout is one of the most expensive leaks in any ticket sales funnel. Every buyer who fills out a form and then backs out represents a nearly-closed sale.
Xendit’s checkout process is optimized to minimize this. Multiple payment methods, fast processing, and a clean form layout all reduce the friction that causes abandonment.
For a technical understanding of how Xendit processes payments and what happens at each step of checkout, the Xendit work GamificationSummit breakdown explains the full payment architecture.
Instant Confirmation Protects Buyer Trust
The moment a payment clears, an automated confirmation fires to the buyer’s inbox. This is not a courtesy — it is a trust signal.
A buyer who receives immediate confirmation does not email support asking if their payment went through. They do not dispute the charge with their bank. They do not leave a negative review about the experience.
Confirmation email open rates above 85% indicate a healthy post-purchase experience. If your rate falls below that, check your sender reputation and delivery timing first.
| EXPERT INSIGHT
Confirmation email deliverability is a technical issue that many event teams treat as a content issue. Before you rewrite your confirmation email subject line, check whether it is landing in spam folders. Use a tool like Mail-Tester (free) to test your email deliverability score before your ticket sale opens. A deliverability score below 8/10 means a percentage of your buyers are not receiving their tickets — and they are not happy about it. |
Two Unique Angles the Competition Misses
Most content about event ticket effectiveness covers conversion rates and channel performance. Two areas consistently get ignored — and both directly affect ticket sale effectiveness gamificationsummit outcomes.
Angle 1: The Early Bird Window as a Forecasting Tool
Early bird ticket sales are usually framed as a discount strategy. They are actually your best forecasting signal.
If early bird uptake hits 35% of your target within the first two weeks, your event is on track. If it hits 15%, you have a signal problem — people do not know about the event, do not understand the value, or do not trust the platform yet.
Catching that signal at week two gives you six to eight weeks to course-correct. Catching it at week eight gives you nothing.
Track early bird uptake as a leading indicator, not just a revenue line item.
Angle 2: Post-Event Data as Pre-Sale Intelligence
Most teams close their analytics dashboard the day after the event ends. The buyers who attended just gave you the most valuable data you will ever have for next year’s sale.
Which ticket tier did they buy? Which channel brought them in? How early did they buy? Did they open every pre-event email or just the one with their ticket?
That behavioral profile is the blueprint for your next early bird campaign. The buyers most likely to buy early next year are the ones who bought early this year. Segment them. Contact them first. Give them exclusive access.
This is not complicated. Most teams just do not do it.
| PRO TIP
Export your post-event buyer data before you close out your event management tools. Create three segments: early buyers, standard buyers, and last-minute buyers. Each group needs a different message when your next ticket sale opens. Early buyers respond to exclusivity. Last-minute buyers respond to urgency. Standard buyers respond to social proof. |
Tools That Support Accurate Measurement
Measurement without the right tools produces noise instead of insight. Here are the specific platforms that support accurate ticket sale effectiveness gamificationsummit tracking.
- Google Analytics 4 (GA4): The standard for web behavior tracking. Set up conversion events for ticket page visits, checkout starts, and completed purchases. Free and essential.
- Xendit Dashboard: Provides real-time payment success rates, failed transaction logs, and payment method breakdowns. Directly shows checkout friction points.
- Google Search Console: Tracks which search queries bring visitors to your ticket page. Identifies ranking gaps for ticket-related keywords.
- Email Analytics Platform: Measures open rates, click rates, and unsubscribes on confirmation and pre-event emails. Use these to optimize delivery and content.
- UTM Campaign Tracking: Tags every external link so GA4 can attribute ticket sales to the right channel. Non-negotiable for multi-channel campaigns.
For a comprehensive technical reference on setting up GA4 conversion tracking specifically for event ticket pages, the Google Analytics 4 measurement documentation is the most authoritative and up-to-date resource available — maintained directly by Google’s engineering team.
For structured guidance on how search engine authority and EEAT signals affect ticket page visibility in organic search, the Google Search Central — Creating Helpful Content guide is the definitive reference for understanding how Google evaluates and ranks event and ticketing pages.
Common Measurement Mistakes to Stop Making
Knowing what to measure matters. Knowing what not to do with the data matters just as much. Here are the mistakes that consistently distort ticket sale effectiveness tracking.
- Measuring too late. Pulling analytics in the final week of ticket sales gives you nothing to act on. Set weekly review checkpoints from the day your sale opens.
- Reporting totals without segments. ‘We sold 300 tickets’ is not a useful data point. ‘300 tickets — 60% from email, 25% from organic search, 15% from paid ads’ is.
- Ignoring mobile behavior separately. Desktop and mobile buyers behave differently at checkout. A conversion problem that only affects mobile users will be invisible in combined data.
- Treating a failed payment as a lost buyer. Many failed payments are recoverable within 24 hours. If your system does not send a payment retry reminder, you are losing buyers who were ready to convert.
- Not benchmarking against previous events. Your most relevant benchmark is your own past performance — not an industry average from a completely different event category.
| REAL TALK
The most dangerous metric is one that looks healthy but masks a problem underneath. A high overall conversion rate can hide terrible mobile performance. A high email open rate can hide low click-through to the ticket page. Always drill one level deeper than the headline number before you decide things are working. |
Final Verdict
Ticket sale effectiveness gamificationsummit is not a single number. It is a system — a set of behaviors, channels, checkpoints, and decisions that either build momentum or drain it.
The teams that measure effectively do not wait for the final results to tell them what went wrong. They watch the leading indicators — early bird uptake, channel conversion, checkout completion — and make adjustments while there is still time to matter.
GamificationSummit gives you the infrastructure: a clear website method, a trusted payment system through Xendit, and an automated confirmation flow that closes the loop with every buyer. What you bring is the discipline to measure each part of that system and act on what you find.
The question worth asking right now: At this exact moment in your event sales cycle, do you know which metric is underperforming — and do you have a plan to fix it before it costs you seats?
Julian Thorne is a distinguished Technical Strategist and Fintech Analyst with over 6 years of experience in digital payment architectures. Specializing in the integration of high-performance gateways like Xendit, she focuses on optimizing the intersection of gamification and online ticketing systems. Julian’s expertise lies in deconstructing complex payment flows and enhancing sales effectiveness through data-driven insights. Her recent work deeply explores the evolution of digital event platforms in 2026, providing actionable strategies for global summits and large-scale ticketing infrastructures.